.jpg "Why Do You Get Inconsistent Readings at the Same Spot with an Ultrasonic Thickness Gauge? 1")
During pipeline routine inspection, field technicians frequently encounter a confusing issue: without replacing the probe or noticeably shifting the measuring point, the thickness value displayed on the screen keeps changing. Sometimes only the last digit fluctuates slightly, while other times two consecutive measurements deliver drastically different figures. When this happens, you cannot simply regard the smaller reading as wall thinning caused by corrosion, nor can you average multiple readings arbitrarily. The test result of an ultrasonic thickness meter relies on three core factors: sound velocity, sound wave travel time and echo recognition. Instability in any link will alter the final displayed value.
Based on its working principle, the probe sends ultrasonic pulses through the workpiece, which bounce off the back wall or material boundaries. The ultrasonic thickness gauge computes thickness using the recorded round-trip acoustic travel time and pre-set sound velocity. While the formula is simple, real workpieces differ greatly from standard reference blocks: pipes often carry anti-corrosion coatings and rust, elbows have curved surfaces, and inner walls may suffer pitting corrosion or residue buildup. Operators must confirm three critical factors: the reading targets the true back wall, sound velocity matches the tested material, and probe coupling remains consistent for every measurement.
1. Incorrect Sound Velocity Setting Leads to Systematic Deviations
Even for the same metal material, sound propagation speed varies under different working conditions. Material grade, heat treatment status, internal microstructure, rolling direction and ambient temperature all affect acoustic transmission performance. The built-in sound velocity values preloaded in the digital thickness gauge are only for initial reference. For high-standard inspection tasks, the most reliable approach is to calibrate sound velocity with reference blocks that share identical material and processing conditions and feature confirmed thickness data.
Errors in sound velocity settings create deceptive results: readings may appear highly repeatable yet remain entirely higher or lower than the true value. Stable repeatability never equals accurate measurement. If inspectors only check reading consistency without cross-verifying against reference test pieces, systematic bias will be mistaken for real wall thickness loss. Every time you switch materials, probes, temperature ranges or measurement modes, reset the zero point and calibrate reference values accordingly.
-300x225.jpg "Why Do You Get Inconsistent Readings at the Same Spot with an Ultrasonic Thickness Gauge? 2")
-300x225.jpg "Why Do You Get Inconsistent Readings at the Same Spot with an Ultrasonic Thickness Gauge? 3")
-300x225.jpg "Why Do You Get Inconsistent Readings at the Same Spot with an Ultrasonic Thickness Gauge? 4")
2. Inconsistent Coupling Conditions Cause Unstable Echo Signals
Ultrasonic waves cannot travel through the air gap between the probe and the workpiece, so coupling agent is mandatory during testing. Insufficient coupling agent will trigger intermittent echoes, while excessive coating also brings drawbacks—especially on rough surfaces, small-diameter curved pipes or thin workpieces, variations in coupling layer thickness distort waveform signals. Probe pressing force, tilt angle and contact duration also exert notable impacts.
A simple field verification method: lift the probe completely and reattach it to the same spot 3–5 times in a row. If readings repeat stably and echo waveforms remain nearly identical, the coupling environment is consistent. If numbers stay steady only when the probe stays pressed without lifting but shift sharply after repositioning, you need to recheck surface cleanliness, workpiece curvature and probe placement angle.
3. Special Positions Such as Small-Diameter Pipes, Elbows and Weld Zones Require Customized Operations
On flat plates, the entire probe face can fully fit the workpiece surface. When measuring small-bore pipelines, however, both sides of the probe may hang suspended, making the sound beam deviate from the normal line of the pipe wall. Matching exists between the probe dividing line orientation, probe face size and pipe curvature. Even if the portable thickness gauge outputs a numerical value with an oversized probe, the sound transmission path may not meet test standards.
Thickness distribution is uneven on the outer arc, inner arc, erosion-prone zones and heat-affected areas of welds on elbows; a single measuring point cannot represent the overall wall condition. Before testing, map measuring points according to fluid flow direction, pipe diameter and historical corrosion records. Once abnormal low values appear, add extra surrounding test points instead of only collecting data at the most convenient contact positions.
-e1785998045884.jpg "Why Do You Get Inconsistent Readings at the Same Spot with an Ultrasonic Thickness Gauge? 5")
4. Coated Workpiece Testing: Confirm Which Interface the Instrument Identifies
Paint, anti-corrosion coating and adhesive layers form multiple acoustic interfaces with the metal substrate. Ordinary measurement modes may include the sound travel time through coatings into the final thickness result, or generate false locking triggered by coating signal attenuation and interface echoes. Multi-layer measurement functionality enables operators to distinguish coating interfaces from substrate back walls.
Still, multi-layer recognition does not guarantee automatic separation of all layered structures. Echoes will overlap if adjacent layers have similar acoustic properties; air bubbles, pores or delamination inside coatings also complicate waveform signals. Under such circumstances, validation with known multi-layer standard samples is essential, rather than adjusting parameters repeatedly to force a seemingly reasonable reading.
Take Mikrosize’s iThick-4000 Ultrasonic Thickness Gauge as an example: it supports optional coating penetration thickness measurement to directly capture the thickness of base metal while ignoring surface covering layers, perfectly solving reading interference brought by paint and rust coatings in ultrasonic thickness gauge for pipe corrosion inspection.
5. A-Scan Waveform Display Helps Trace the Source of Thickness Readings
Judging purely by thickness figures makes it impossible to tell whether the gauge locks onto the target back wall, coating interface or clutter wave peaks. When waveforms stay stable, echo positions from the same interface show good repeatability. If readings jump with obvious drifting of echo peaks, adjust signal gain, measuring range, predicted thickness value, recheck coupling performance and probe placement posture.
Waveform visualization is not a universal fix. Severe corrosion, tilted back walls, layered defects and coarse grain attenuation demand professional advanced ultrasonic testing techniques. A standard digital ultrasonic thickness tester only calculates thickness based on sound transmission paths and cannot independently judge defect geometry, equipment residual service life or safe operating limits.
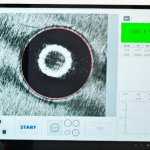
The iThick-4000 Ultrasonic Thickness Gauge from Mikrosize is equipped with an A-scan snapshot function. Technicians can view real-time ultrasonic waveforms on the screen, verify the authenticity of thickness data, analyze the root causes of fluctuating readings and troubleshoot measurement errors efficiently via intuitive A-scan ultrasonic thickness testing.
6. Continuous Scanning Locates Abnormalities, but Fixed-Point Recheck Is Required for Valid Data
Continuous measurement mode allows technicians to slide the probe slowly along pipe sections to track local thin points and thickness variation trends. Nevertheless, probe pressure, moving speed and coupling agent distribution keep changing during scanning, so instantaneous minimum values shown on screen do not all represent valid corrosion thinning.
The standardized operation flow is: pause scanning once low readings are detected, clean the measuring spot, reapply coupling agent, rotate the probe to take multiple repeated measurements, and confirm waveform stability before recording the data as official records.
7. High Resolution Does Not Equal Minimal Field Measurement Error
Many buyers confuse high display resolution with ultra-low field error. Resolution only refers to the minimum incremental step of displayed values. Actual comprehensive measurement error is affected by probe performance, sound velocity calibration, reference blocks, temperature, surface roughness, workpiece curvature, coupling consistency and echo recognition accuracy.
For corrosion trend monitoring, long-term comparability of data collected under identical test conditions (same spot, same equipment, consistent temperature and recording standards) matters far more than decimal precision of a single reading. Without archived records of probe model, sound velocity parameters and exact measuring locations, even high-resolution numerical values cannot distinguish real wall thinning from changes in testing conditions.
The iThick-4000 Ultrasonic Thickness Gauge offers user-switchable measurement resolution (metric X.XX / X.X, imperial 0.001in / 0.01in), catering to both precision laboratory testing and quick on-site inspection scenarios for different industries. As a reliable industrial non-destructive thickness meter, it adapts to diverse detection standards across metal processing, pipeline maintenance and aerospace manufacturing.
8. Mandatory Field Recording Items to Ensure Data Traceability
Complete archives eliminate disputes caused by inconsistent repeated measurements and support long-term corrosion trend analysis. The core recording contents are listed below:
|
Recording Item |
Recording Purpose |
|
Equipment serial number & precise measuring coordinates |
Locate identical inspection zones for follow-up retests |
|
Material grade, nominal thickness & surface condition |
Provide background reference for sound velocity setup and abnormal data analysis |
|
Tester model, probe specification & calibrated sound velocity |
Ensure comparability between inspection batches |
|
A-scan waveform status & repeated measurement results |
Judge whether readings come from stable effective echoes |
|
Supplementary measuring points & recheck explanations |
Prevent accidental false readings from being misjudged as local corrosion defects |
Final Conclusion
When inconsistent thickness readings appear at the same measuring position using a portable digital ultrasonic thickness gauge, averaging data should never be your first step. Follow the troubleshooting sequence: check sound velocity calibration → zero calibration → workpiece surface treatment → coupling condition → surface curvature → echo waveform recognition. Only after confirming stable test conditions can data be used for corrosion trend tracking, batch quality inspection and quality traceability archives. For pressure vessel safety evaluation, maintenance scope confirmation or test result dispute judgment, certified inspectors must deliver conclusions combined with current inspection specifications and multi-dimensional test data.
-150x150.jpg)